*****************************************************************************************************************************************************************************************************
*Note: For XP Professional and XP Standard edition, the quantity of I/O Tags in the data log file is restricted by License. For WinCE edition, it is 50.
****************************************************************************************************************************************************************************************************
Both Data Log Trends and Realtime Only trends are both Real Time. Data Log Trends record data to the hard drive of the SCADA node. Realtime Trends do not record data to the hard drive.
Real-Time Only Trends have fixed time spans. Always 240 samples and the sample rate are fixed during configuration (1,2,3,4…600) seconds. Once the data scrolls off the screen, it is lost. Real-time Only trends have no impact on Disk Space, since they do not store data to the hard drive. Real-Time Trends are used for Tuning Displays and other display where only short-term trend data is required. You can add tags or replace tags on the fly as long as a Trend group is configured with at least one tag.
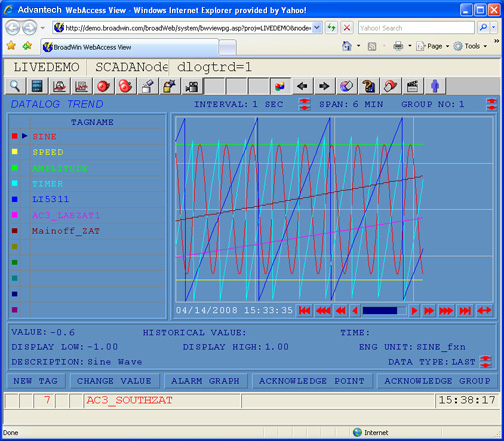
Data Log Trends are more flexible. These are Historical and Real-time Trends. Data is recorded to the Hard Drive of the SCADA node. Users can change the time span on the Fly from seconds, to minutes to hours using the up/down arrows in the center of the screen next to interval:sec. Tags can be added and removed without losing Historical records.
Data Log Trends can be scrolled back and forward through time using the |<< < > >>| buttons on the bottom right.
You can add and replace tags without loosing historical data. You can view the LAST, MAX, MIN, Average of any tag. The catch is that the DATALOG configuration is in two places.
When configuring the Tag you must enable DATALOG and define a Dead band. The base rate is once per second for all Tags, it is compared to the dead band, if it has changed by more than the dead band the tag is recorded.
At least one DATALOG trend Group must be configured. You can add tags to this group or change them.
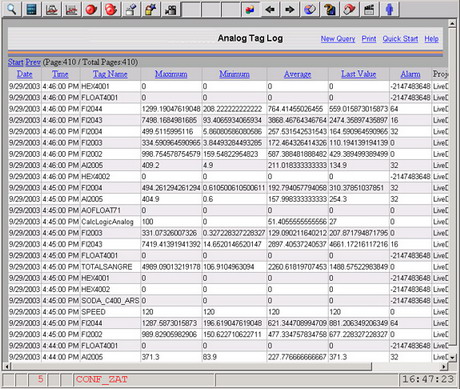
DATALOGGING can also be to a central ODBC-compliant database (Access is the default). Advantech WebAccess/SCADA also provides a query and HTML report function that allows you to view DATA Log trend data in a spreadsheet format, in your web browser, that can be copied and pasted to EXCEL, WORD etc. This is available in VIEW from the right click mouse menu (Tools -> Analog Tag Data or Tools-> Discrete Tag Data).
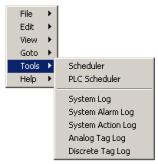
Right Click Menu in Internet Explorer
***************************************************************************************************************************************
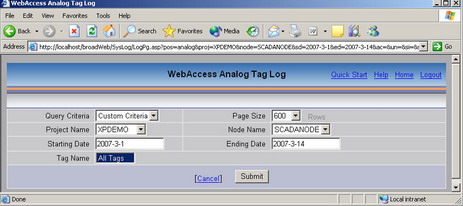
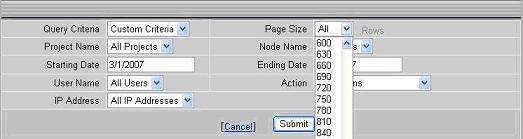
Note: For Windows Vista version, Page Size in various Log Displays can be specified as “All” to display the query result in one page. Please make sure that your computer and network bandwidth can handle the “All” option.
***************************************************************************************************************************************
***************************************************************************************************************************************
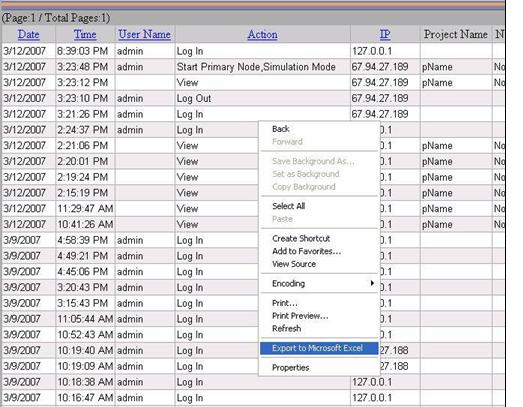
Note: For Windows Vista Version, the query result in various Log Displays can be exported to Microsoft Excel.
For Log Displays in WebAccess Configuration, please click “Export to Microsoft Excel” menu item in right mouse popup menu to export data. A version of Microsoft Excel which supports “Export to Microsoft Excel” must be installed on the computers where IE is run.
***************************************************************************************************************************************
Users can modify the appearance of the Data Log Trend displays. Below is a sample display modified for background color to improve printing.